
(Trace Compass · Trace Event Logger · Linux Tracing Landscape)
Matthew Khouzam & Anh Nguyen | Ericsson Canada | TheiaCon 2025 (Thrilled to be here)
Two key tools for our cache analysis journey:
There are more!
| Type | View |
|---|---|
| Scope |  |
| Flow | 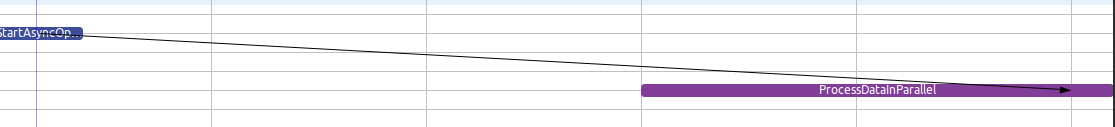
|
| Counter | 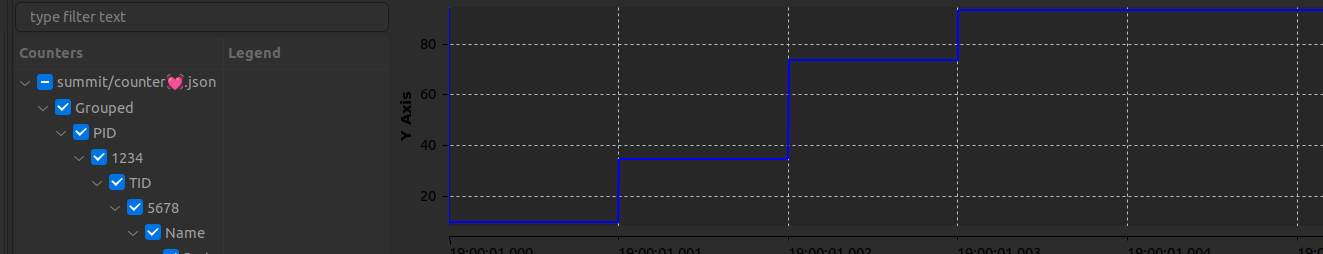
|
| Lifespan | 
|
import * as fs from 'fs';

export class CacheProcessor {
    async processData(data: string[]): Promise {
        console.log("Processing data batch");

        for (const item of data) {
            await this.processItem(item);
        }

        await fs.promises.writeFile('output.txt', data.join('\n'));
    }
}
 import * as fs from 'fs';
+import { TraceLogger } from './trace-logger';

 export class CacheProcessor {
+    private tracer = new TraceLogger();
+
     async processData(data: string[]): Promise {
         console.log("Processing data batch");
+        const span = this.tracer.startScope('processData', { count: data.length });

         for (const item of data) {
             await this.processItem(item);
         }

         await fs.promises.writeFile('output.txt', data.join('\n'));
+        span.end();
     }
 }
export class TraceLogger {
    private events: any[] = [];

    startScope(name: string, args?: any) {
        const start = Date.now() * 1000; // microseconds
        const event = {
            name, ph: 'B', ts: start, pid: process.pid,
            tid: 0, args: args || {}
        };
        this.events.push(event);

        return {
            end: () => {
                this.events.push({
                    ...event, ph: 'E', ts: Date.now() * 1000
                });
            }
        };
    }

    writeTrace(filename: string) {
        fs.writeFileSync(filename, JSON.stringify(this.events));
    }
}

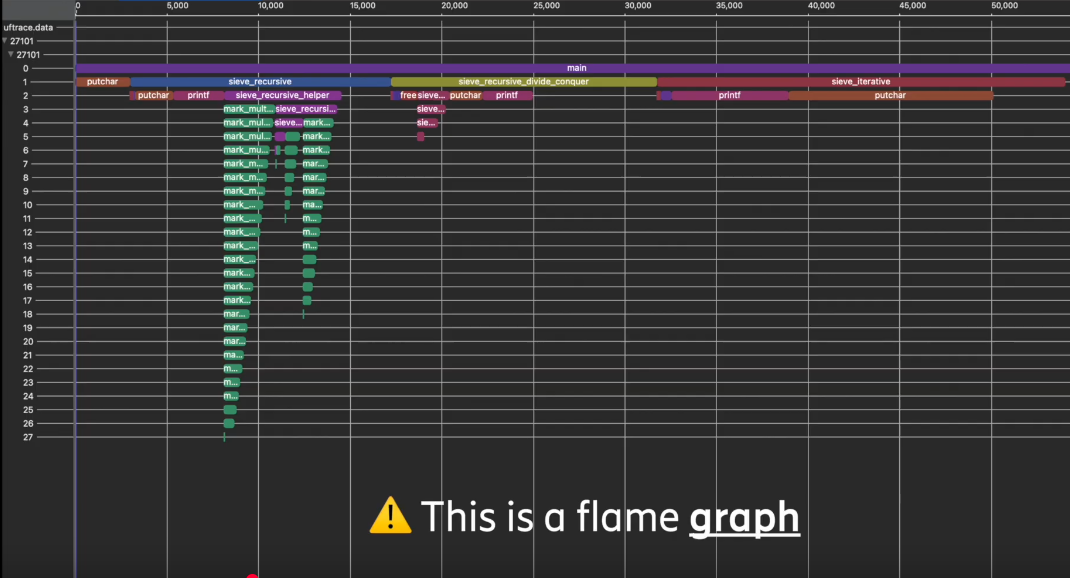
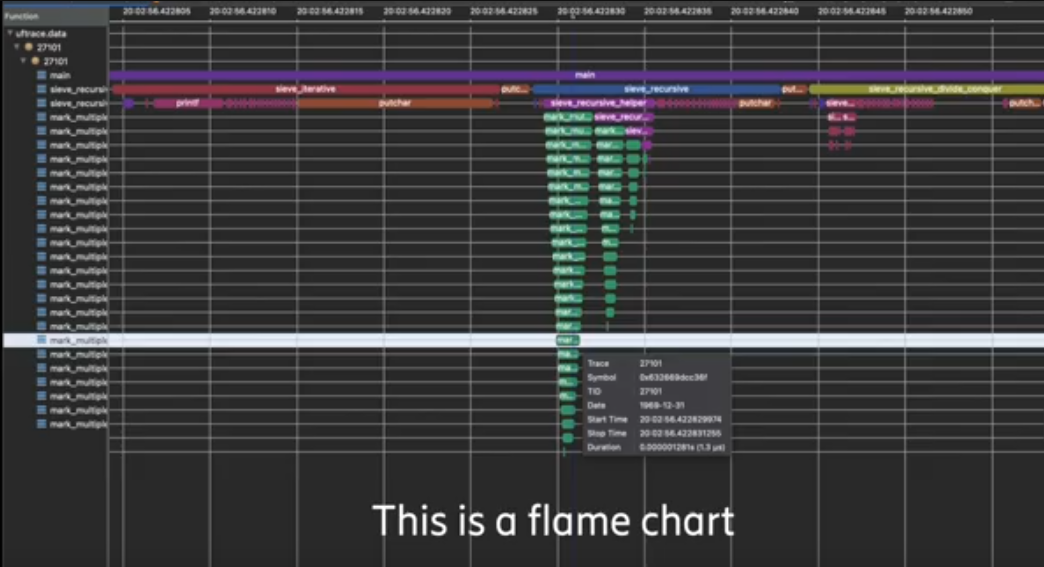
...where one of the latest addition is the Flame Graph

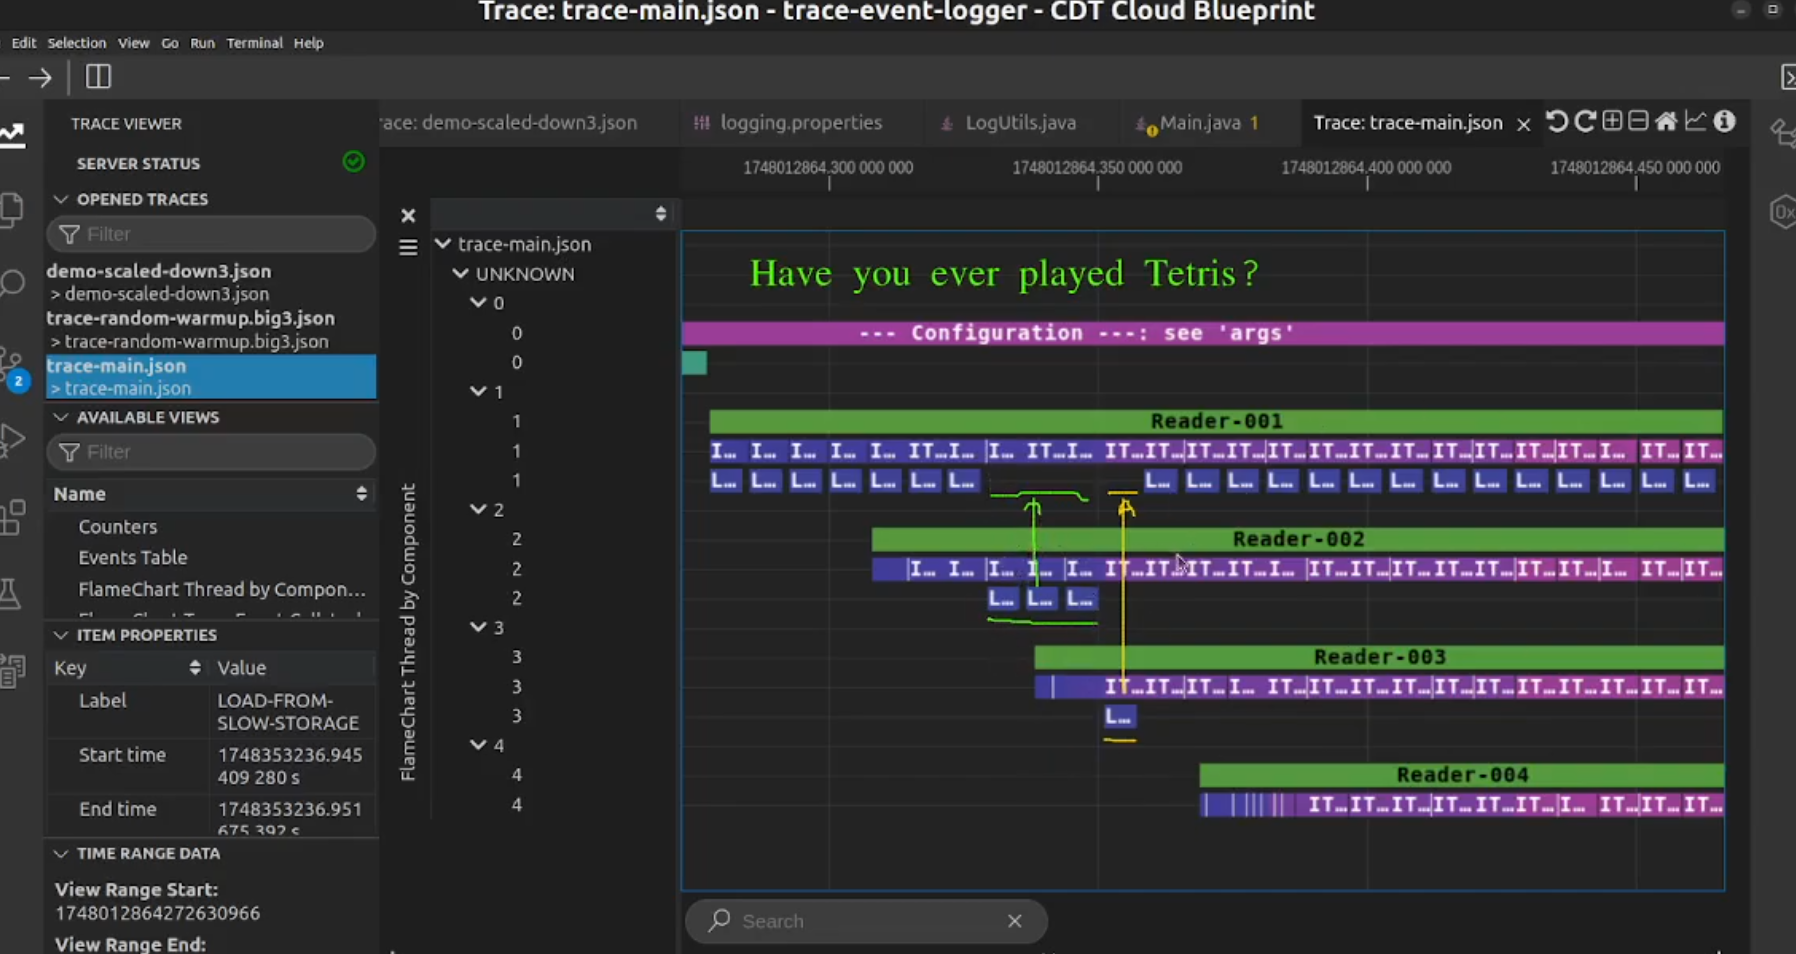
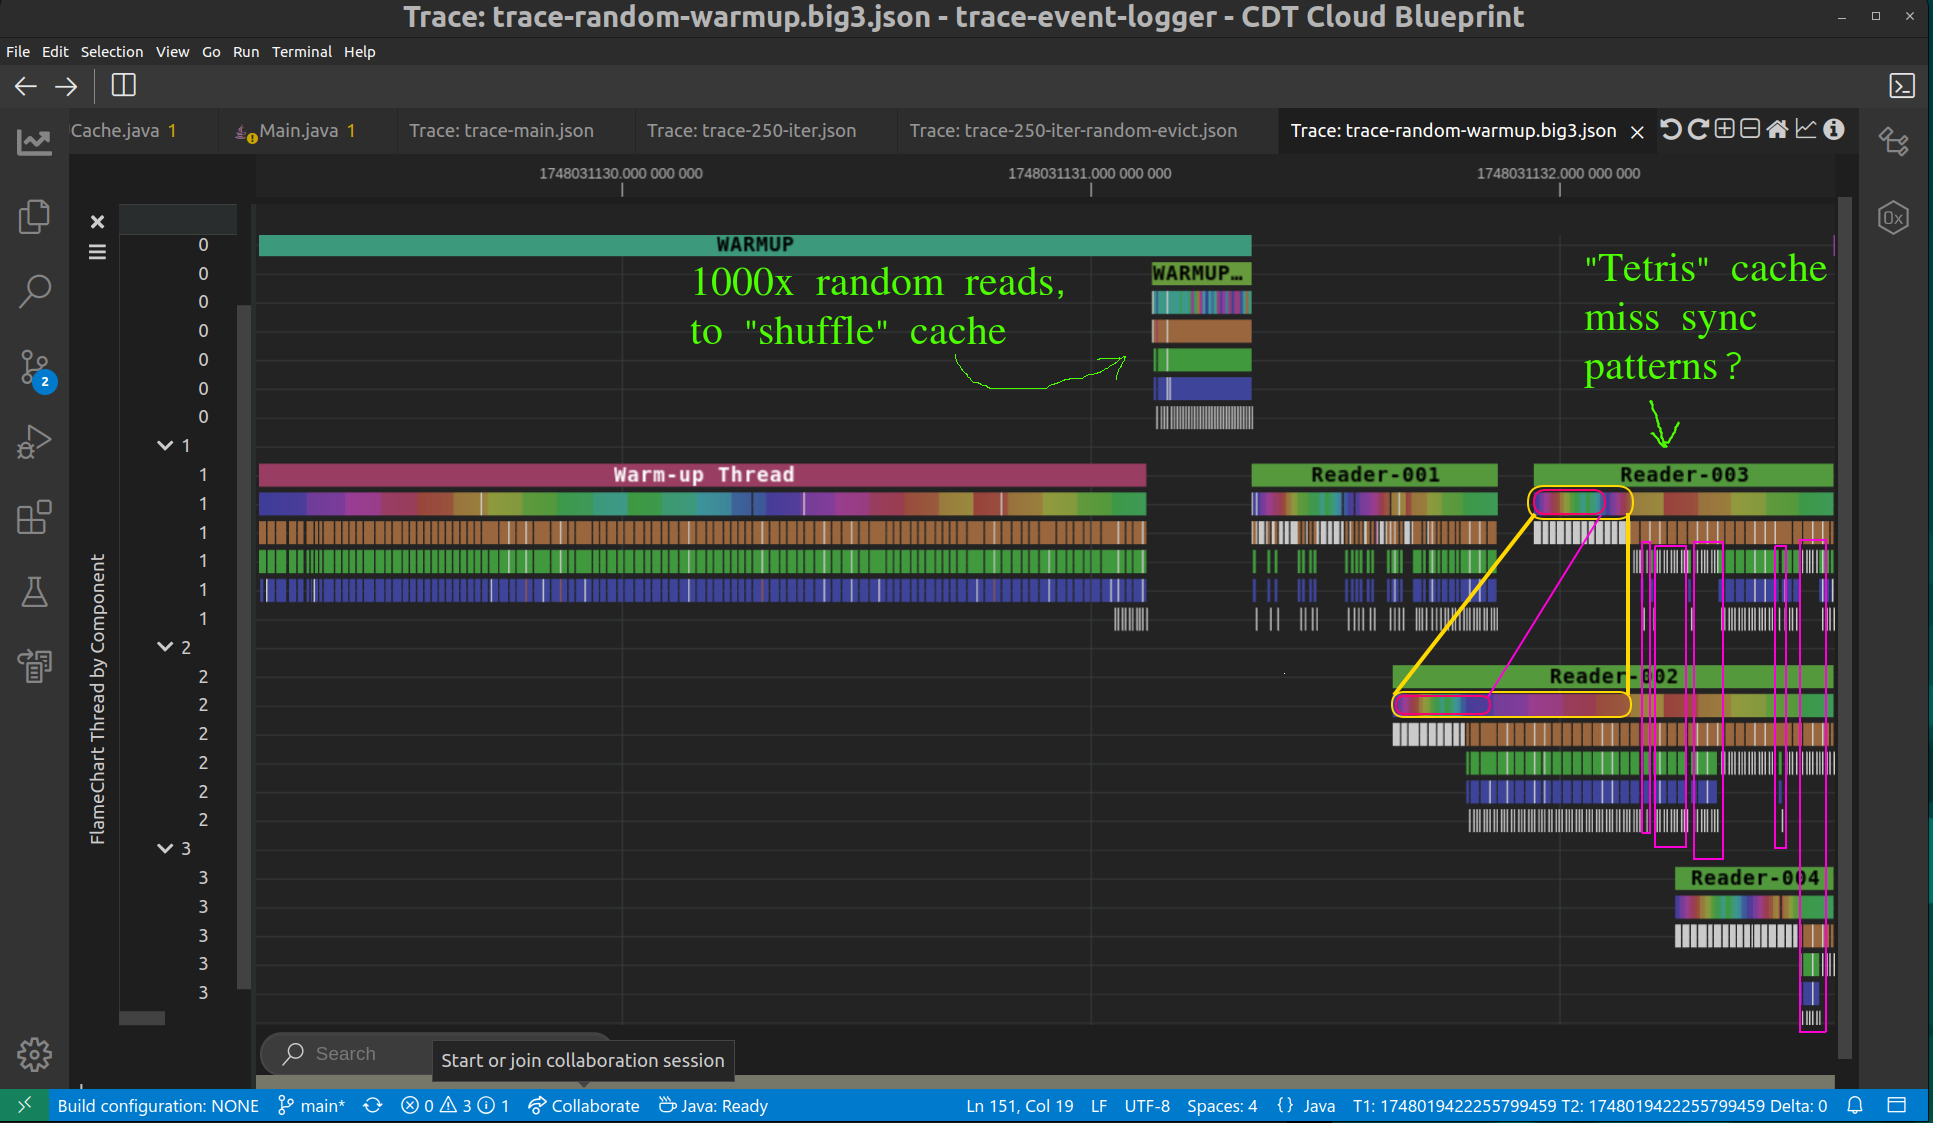
A cache with many threads reading from it:
import java.io.FileWriter;

public class SlappyWag {
    public static void main(String[] args) {
        System.out.println("The program will write hello 10x between two scope logs\n");
        try (FileWriter fw = new FileWriter("test.txt")) {
            for (int i = 0; i < 10; i++) {
                fw.write("Hello world "+ i);
            }
        }
    }
}
import java.io.FileWriter;
import java.util.logging.Level;
import java.util.logging.Logger;
import org.eclipse.tracecompass.traceeventlogger.LogUtils;

public class SlappyWag {

    private static Logger logger = Logger.getAnonymousLogger();

    public static void main(String[] args) {
        System.out.println("The program will write hello 10x between two scope logs\n");
        try (LogUtils.ScopeLog sl = new LogUtils.ScopeLog(logger, Level.FINE, "writing to file"); FileWriter fw = new FileWriter("test.txt")) {
            for (int i = 0; i < 10; i++) {
                fw.write("Hello world "+ i);
            }
        }
    }
}

Let’s discuss your own “good KPIs, bad performance” stories.