Tracing exposes the hidden story behind “green dashboards”.
Instrumentation Strengths
Static instrumentation = always available
Low overhead, high precision
Minimal perturbation to workload
Code examples below.
Original Code
import java.io.FileWriter;

public class SlappyWag {
    public static void main(String[] args) {
        System.out.println("The program will write hello 10x between two scope logs\n");
        try (FileWriter fw = new FileWriter("test.txt")) {
            for (int i = 0; i < 10; i++) {
                fw.write("Hello world "+ i);
            }
        }
    }
}
Instrumented Code
import java.io.FileWriter;
import java.util.logging.Level;
import java.util.logging.Logger;
import org.eclipse.tracecompass.traceeventlogger.LogUtils;

public class SlappyWag {

    private static Logger logger = Logger.getAnonymousLogger();

    public static void main(String[] args) {
        System.out.println("The program will write hello 10x between two scope logs\n");
        try (LogUtils.ScopeLog sl = new LogUtils.ScopeLog(logger, Level.FINE, "writing to file"); FileWriter fw = new FileWriter("test.txt")) {
            for (int i = 0; i < 10; i++) {
                fw.write("Hello world "+ i);
            }
        }
    }
}
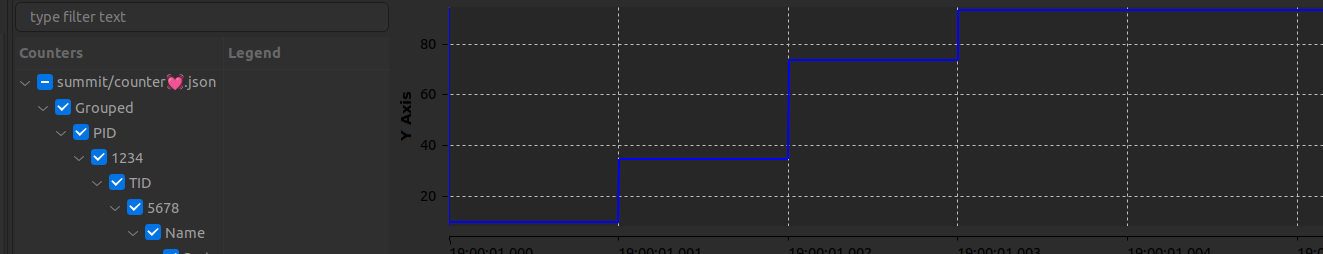
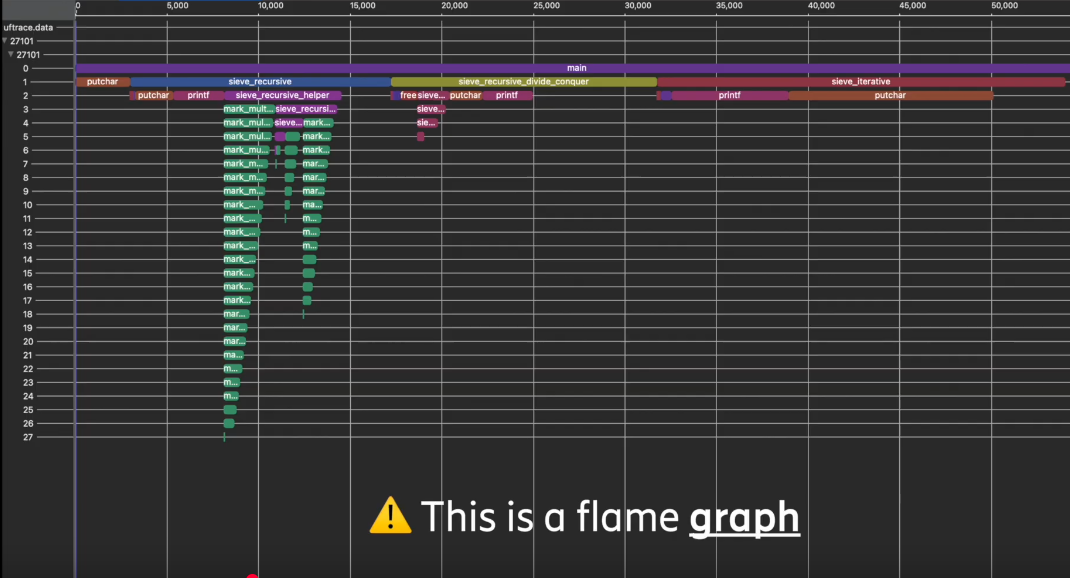
Code Results
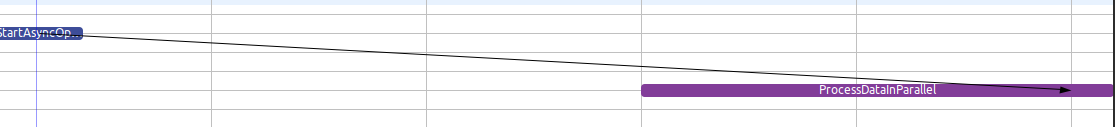
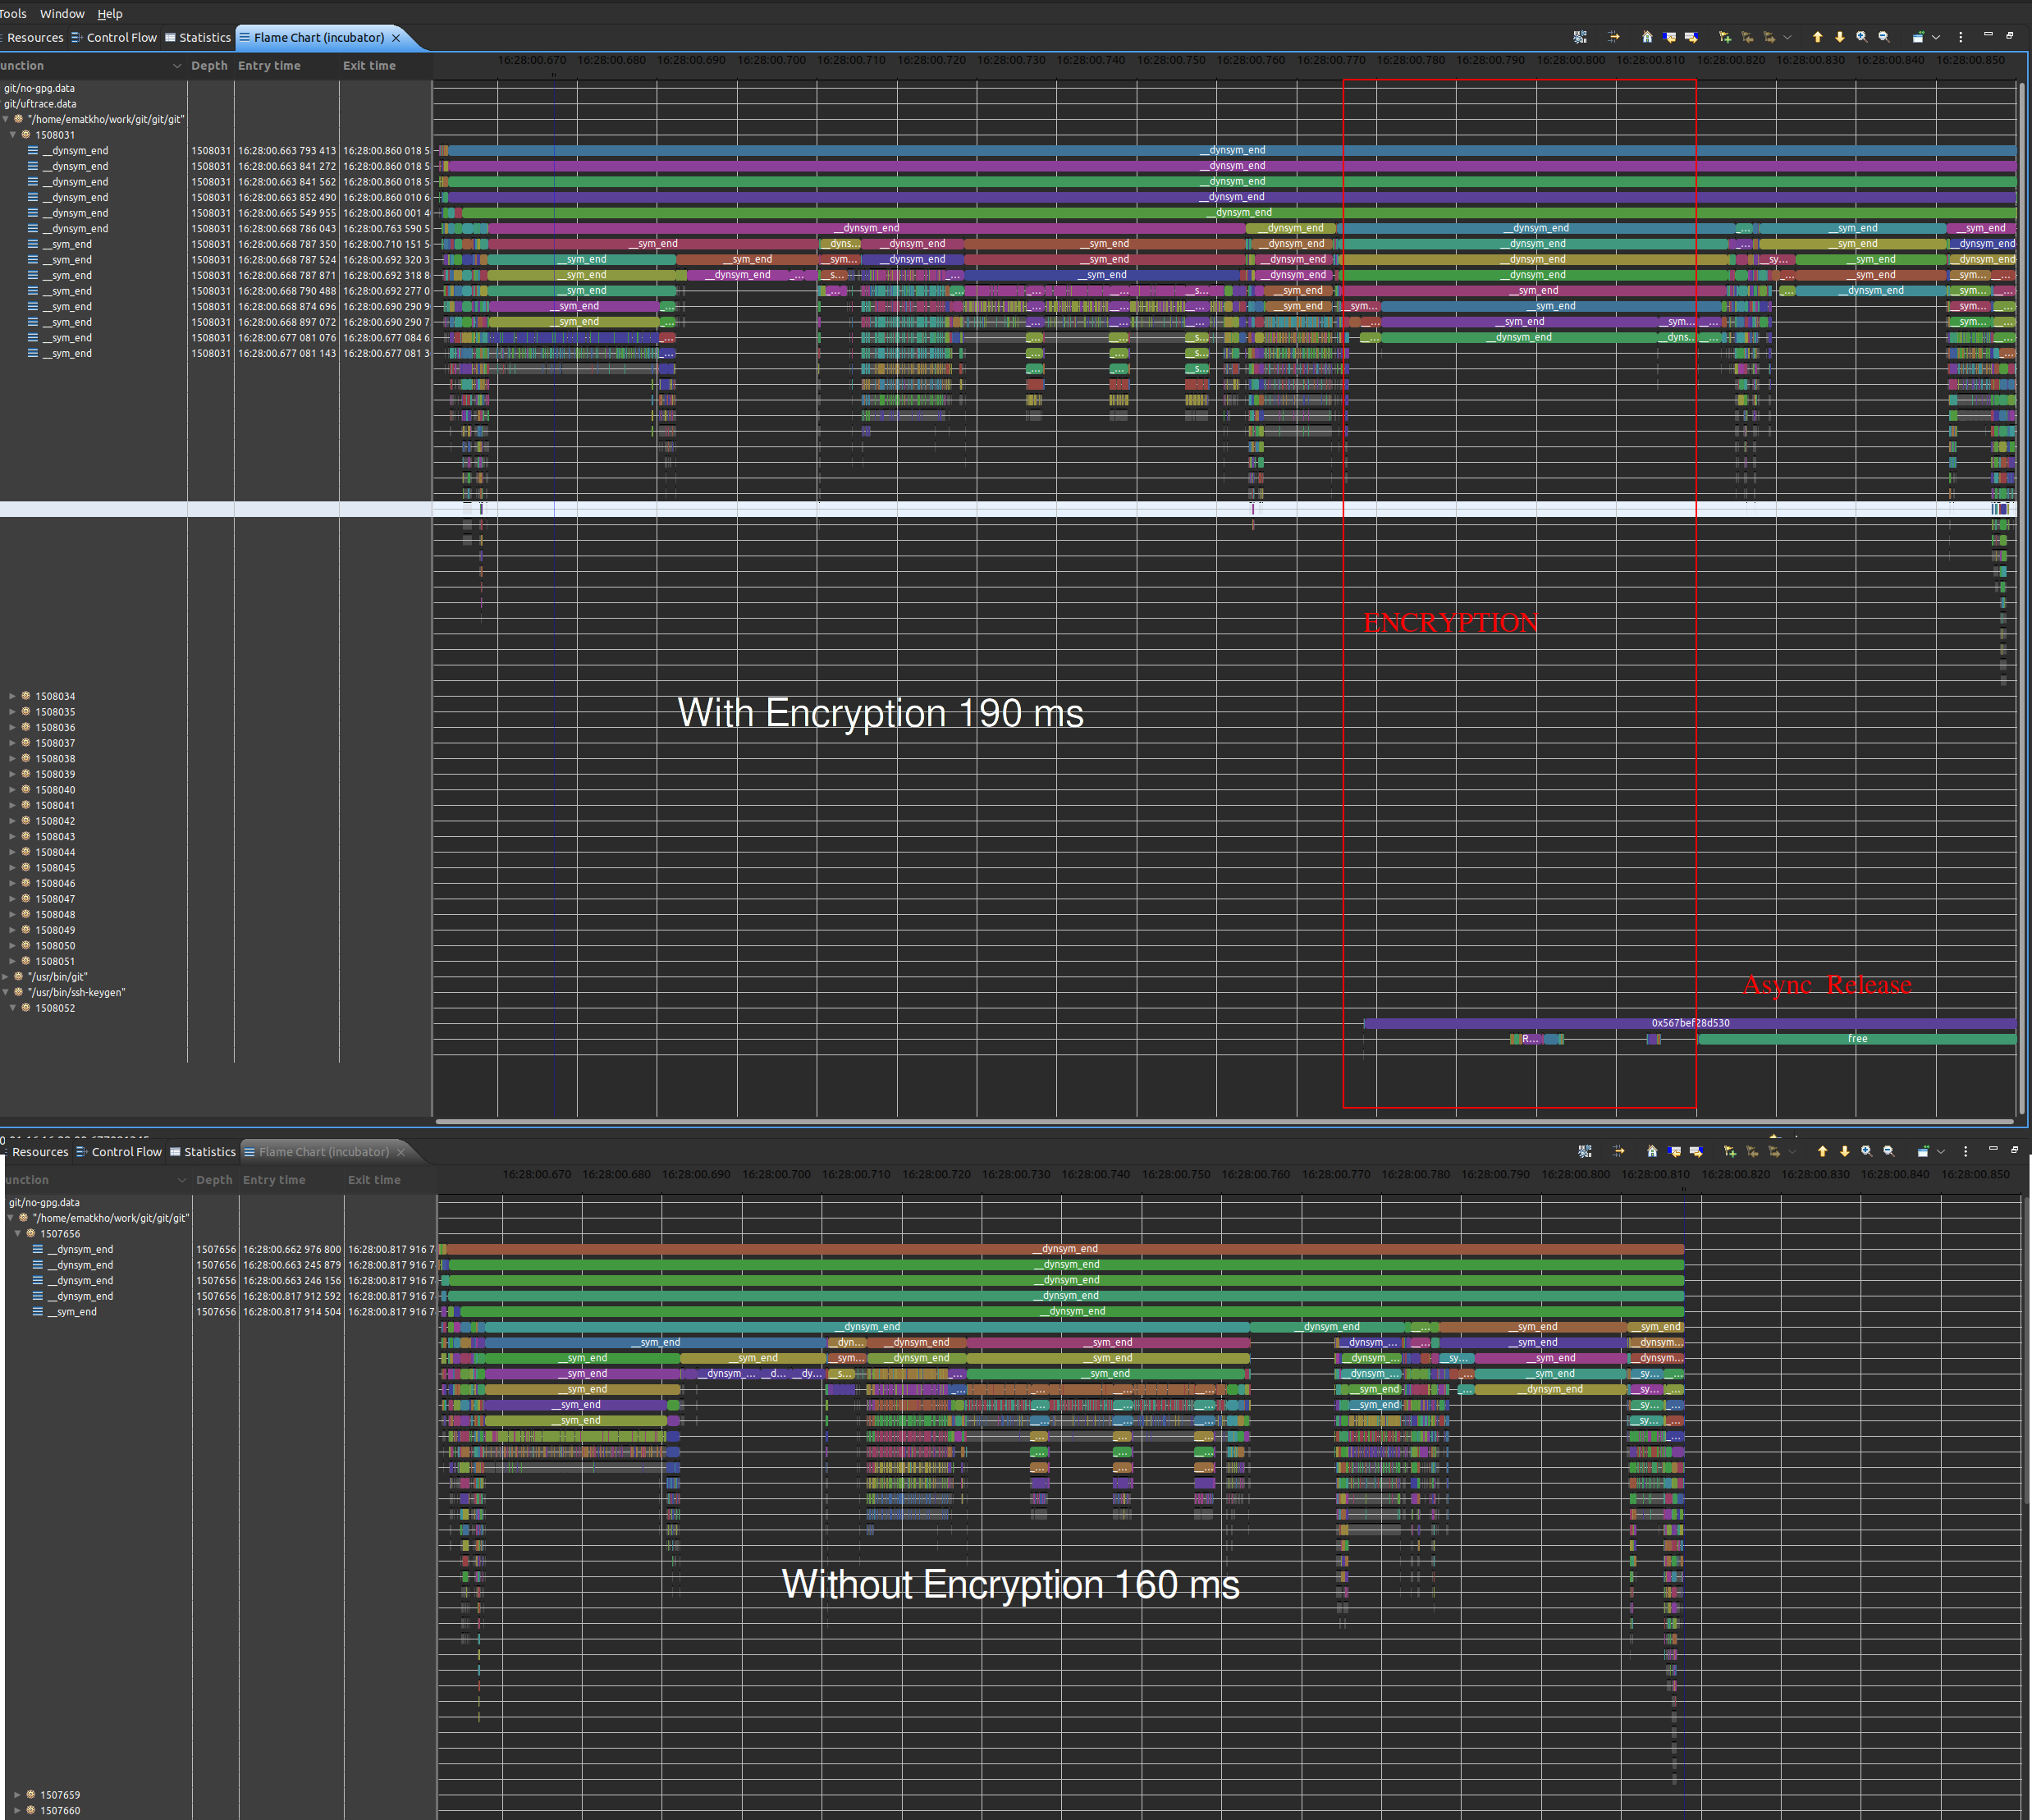
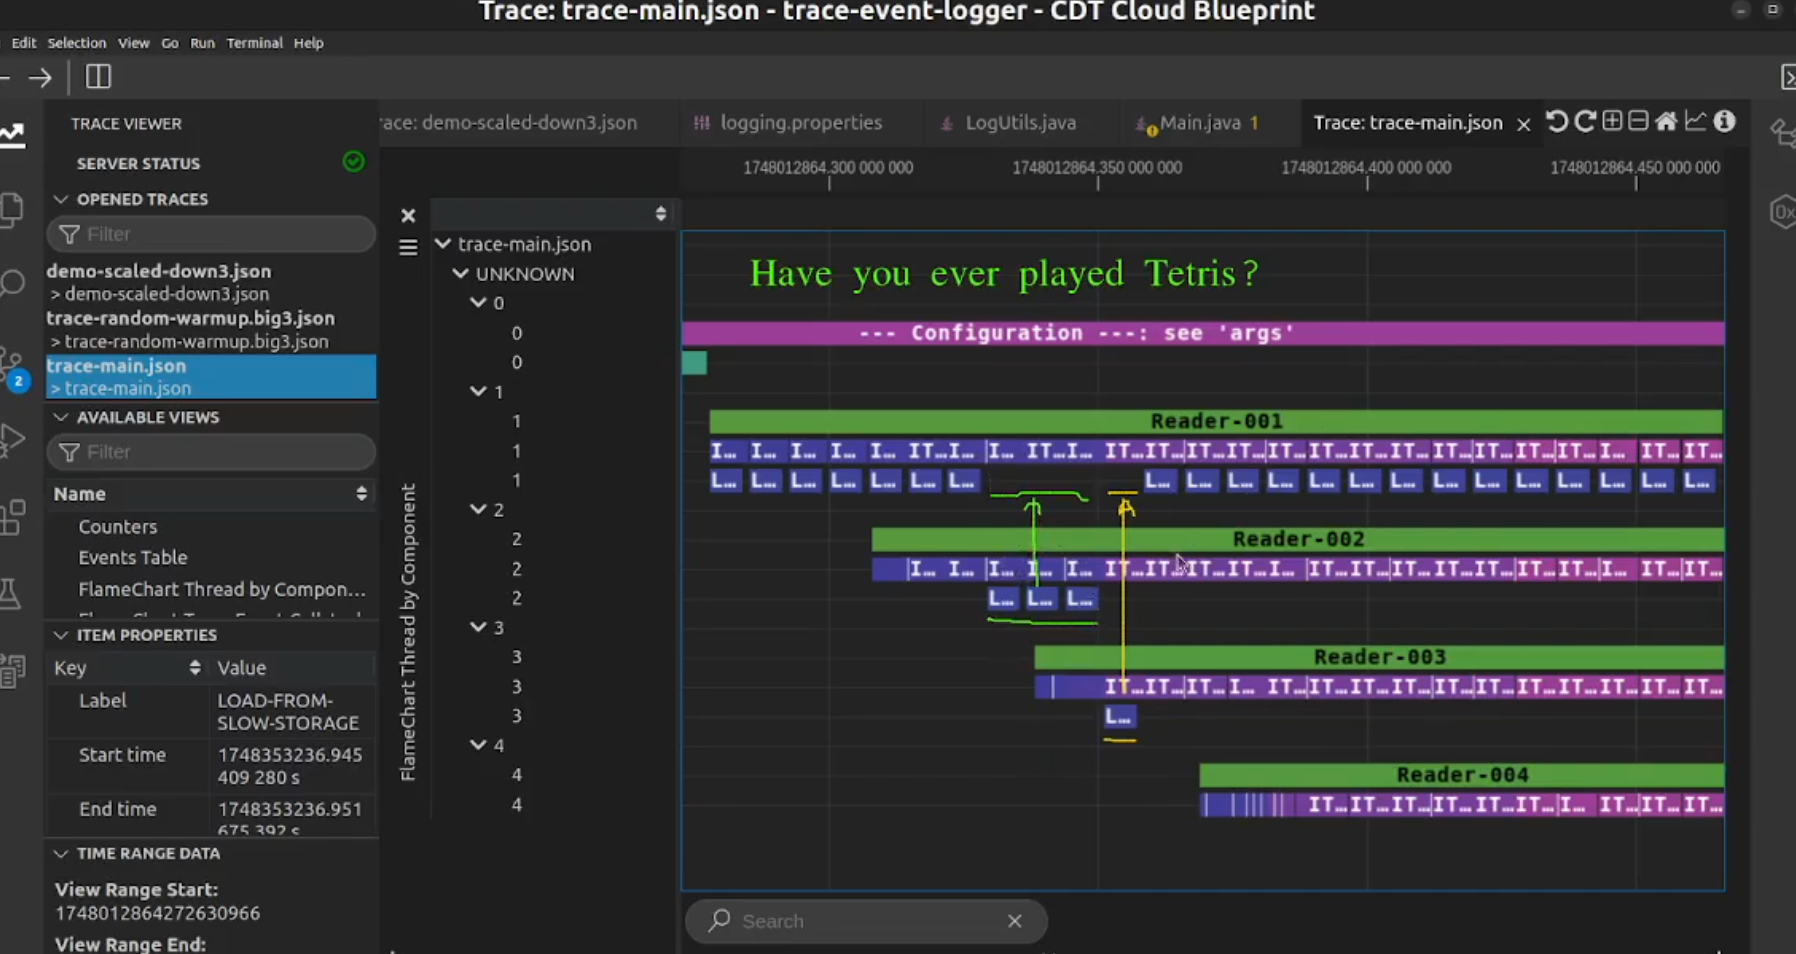
Traces reveal delays at cache boundaries
Clear visualization of synchronous stalls
Scroll down!
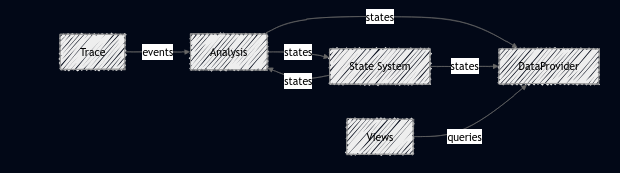
Overview
In depth
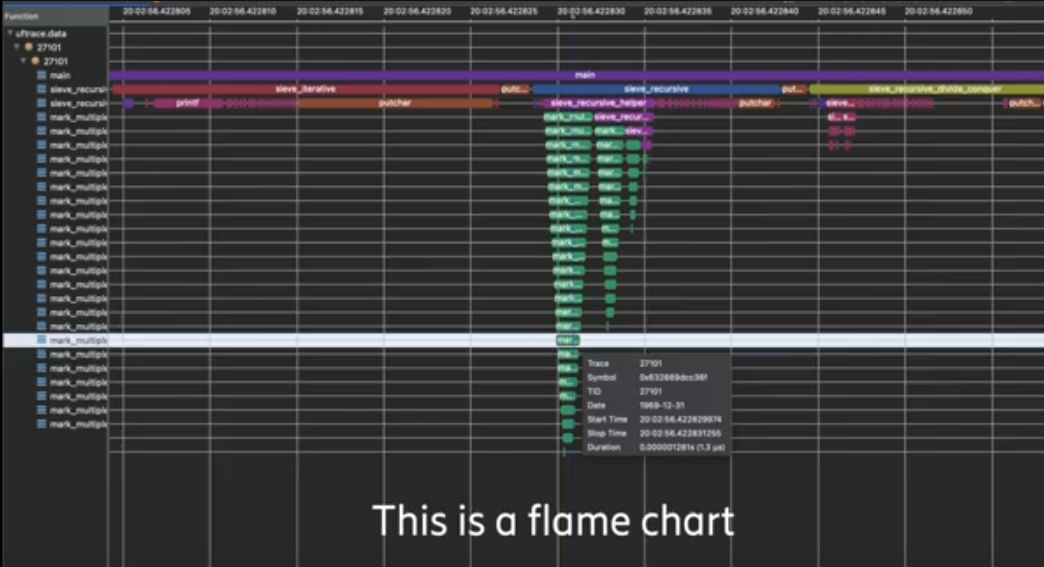
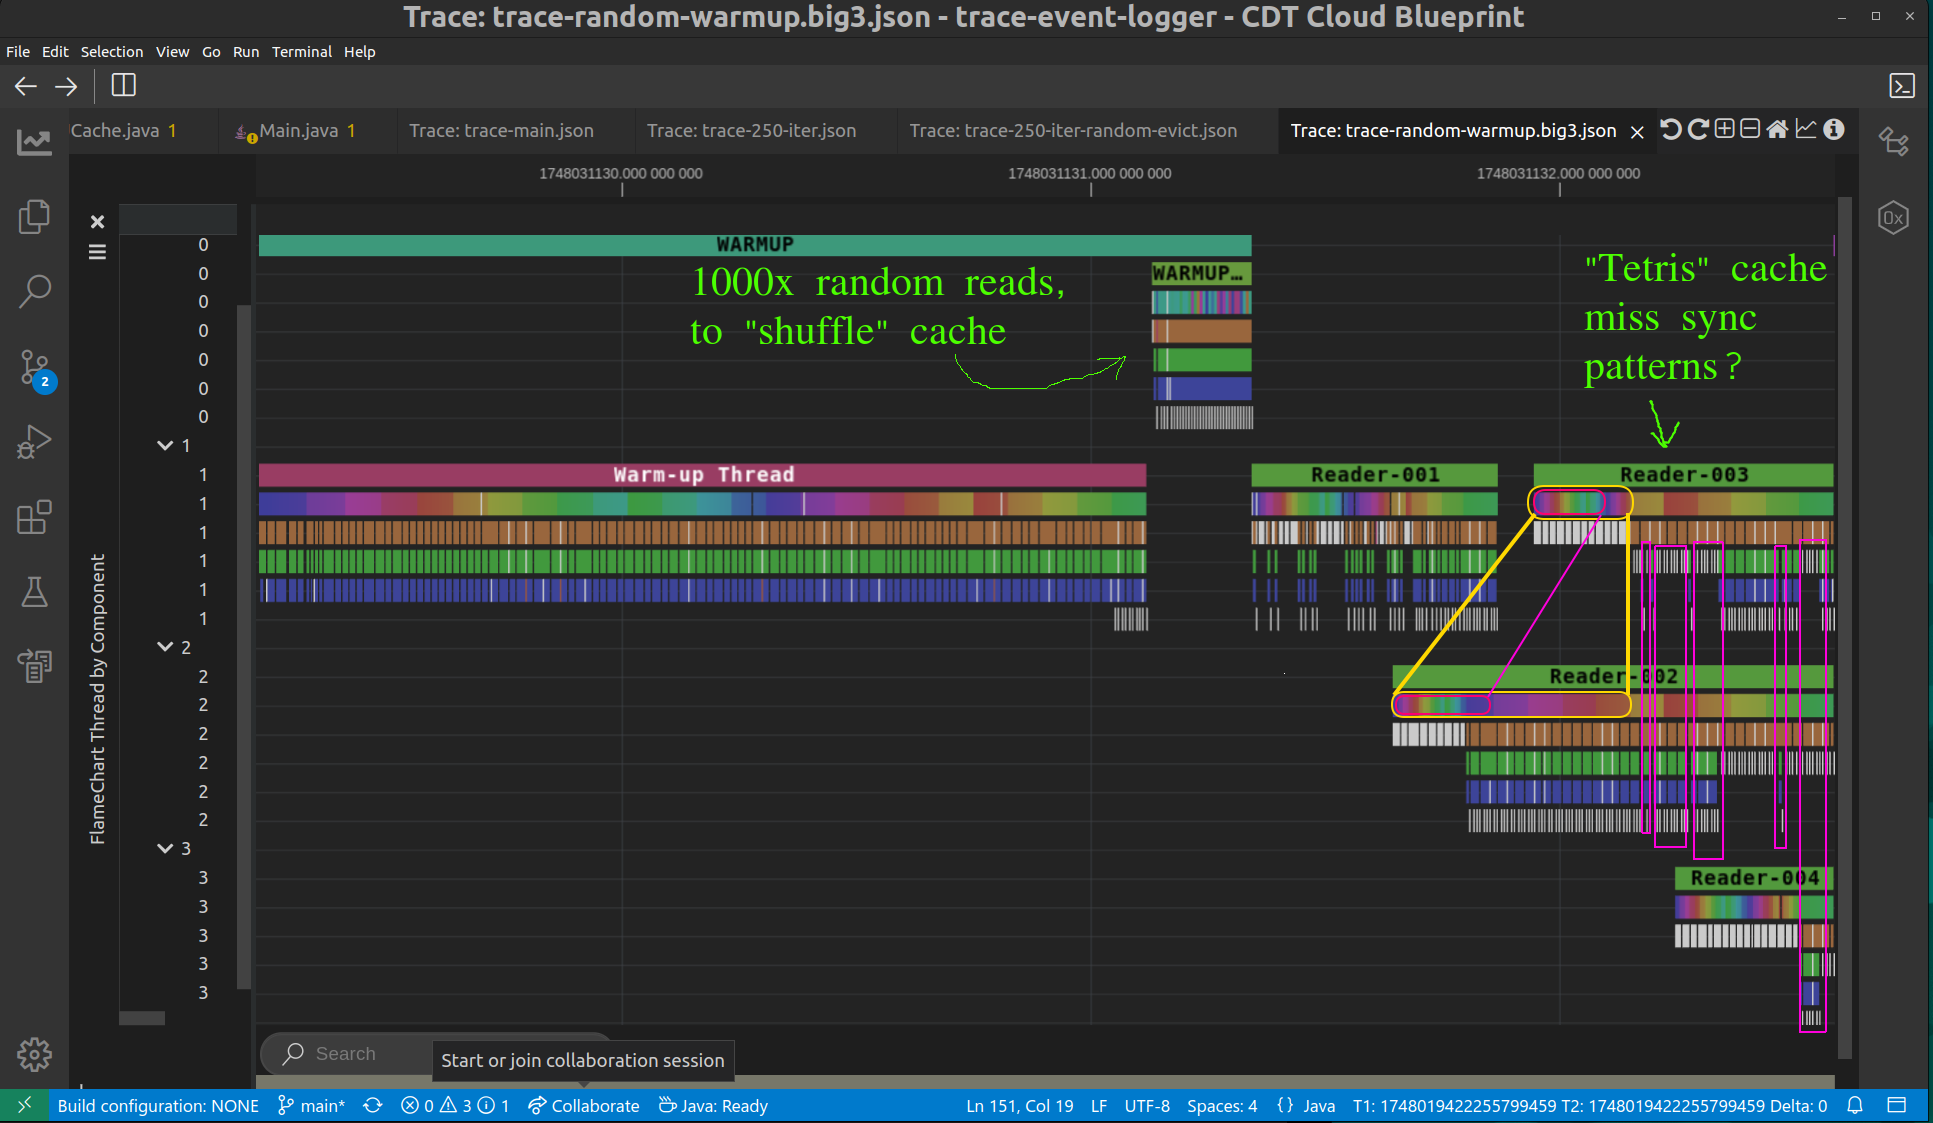
The Cache Miss Story
Synchronous cache misses = correctness intact
But waiting destroys performance
Tracing shows cause, not just symptom
Breather
Takeaways
High-level KPIs can be misleading
Tracing reveals hidden bottlenecks
Cache effects must be contextualized
Trace Compass + Trace Event Logger = deep insight
Questions?
Let’s discuss your own “good KPIs, bad performance” stories.